

 Learn WordPress
Are you a WordPress website owner looking for the best plugins to create stunning infographics and visually appealing data visualizations? Well, look no further!
In this article, we will explore the seven best WordPress infographic and data visualization plugins available, both free and premium, to help you enhance your website with engaging visual content.
Now, you might be wondering why you need these plugins in the first place. The answer is simple: Infographics and data visualizations are incredibly effective in capturing and holding the attention of your website visitors.
They provide a concise and visually appealing way to present complex information, making it easier for users to understand and digest. Plus, they can significantly enhance the overall aesthetics of your website, making it more engaging and memorable.
So, let’s dive right in and explore the top seven WordPress infographic and data visualization plugins that will take your website to the next level.
Whether you’re a beginner or an experienced website owner, this article will provide you with all the information you need to make an informed decision and choose the perfect plugin for your specific needs. Let’s get started!
Best Infographic & Data Visualization Plugins for WordPress
If you are looking to spruce up your WordPress website with eye-catching infographics and stunning data visualizations, look no further! In this article, we’ve compiled a list of the seven best WordPress infographic and data visualization plugins (both free and pro).
These will take your website to the next level. So grab a cup of coffee, sit back, and get ready to explore these amazing tools that will surely captivate your visitors.
Visualizer Plugin
Tables and Charts Manager for WordPress
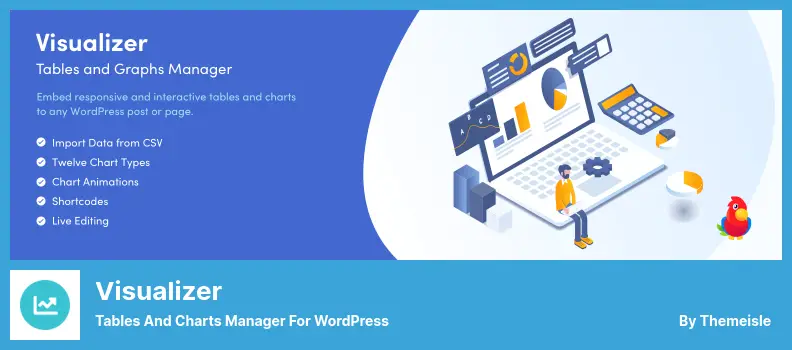
Visualizer is a powerful plugin that allows you to create interactive charts, infographics, and tables for your WordPress website. It is compatible with both Android and iOS devices, making it accessible to a wide range of users.
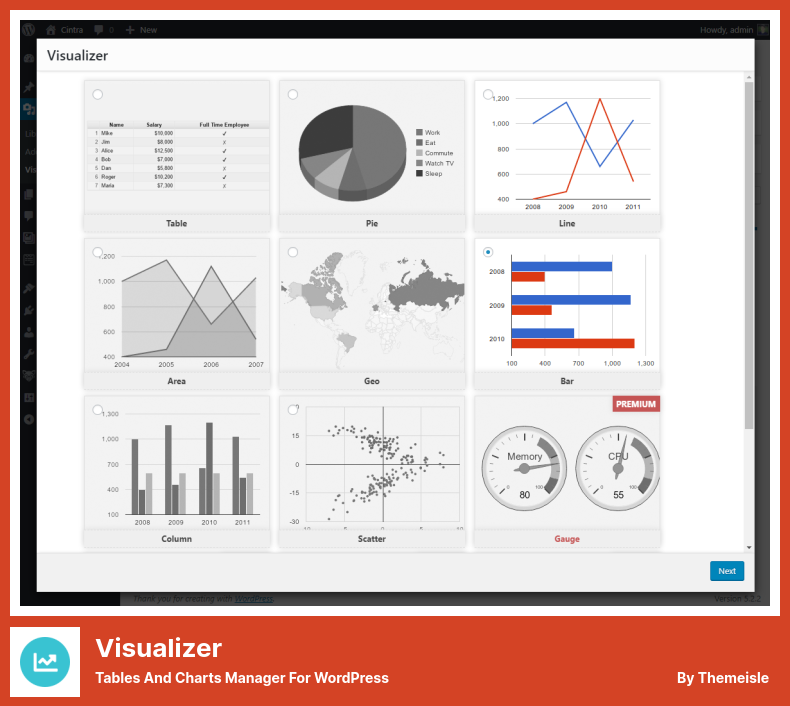
The free version offers a variety of chart types, including line charts, area charts, bar graphs, pie charts, table graphs, and scatter plots. This allows you to choose the best visualization method for presenting your data.
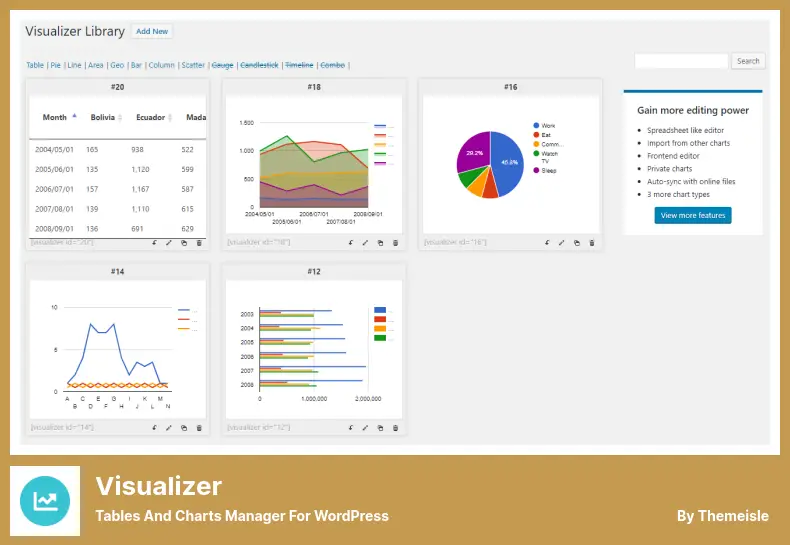
One especially useful feature of it is the ability to create tables on your website. Tables make it easy for visitors to search and sort information, and they can be displayed quickly and simply. With the plugin, you can create tables that are not only visually appealing but also highly functional.
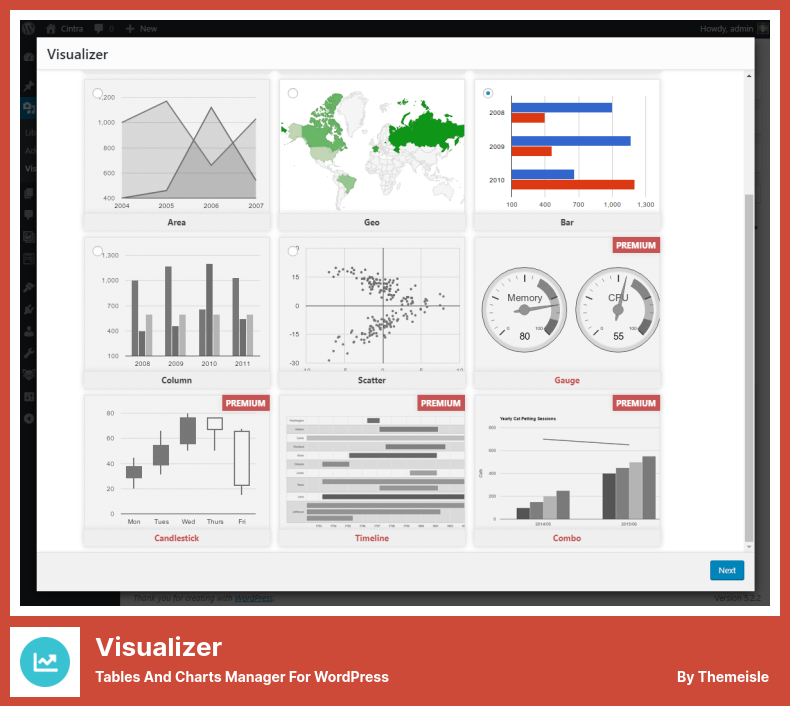
If you decide to upgrade to the pro version, you will gain access to six additional chart types, including combo charts, gauge charts, and various types of timelines. This gives you even more options for visualizing your data.
Another advantage of the pro version is the ability to import data from various sources, such as CSV files, Excel spreadsheets, and Google Sheets. This saves you time and allows you to easily work with data that you already have.
It also offers a wide range of customization options, allowing you to tailor the look and feel of your charts and tables to match your website’s design. Additionally, you can create private charts with customizable permissions, ensuring that only certain users have access to sensitive data.
One standout feature of the plugin is its integration with the Gutenberg editor, which is the default WordPress editor. This means that you can seamlessly create and edit charts and tables directly within your posts, pages, and products.
For those who need ongoing support, the pro subscription includes email support from the Visualizer team. If you’re still not satisfied, you can take advantage of the 30-day money-back guarantee, which allows you to receive a complete refund if you’re not happy with the plugin within the first 30 days of subscribing to the pro program.
Key Features:
- Cross-platform compatibility with Android and iOS devices
- Variety of chart types, including line charts, area charts, etc.
- Table functionality for easy searching and sorting of information
- Offers additional chart types like combo charts, gauge charts, etc.
- Import data from CSV files, Excel spreadsheets, and Google Sheets
- Wide range of customization options for charts and tables
Screenshot:
wpDataTables Plugin
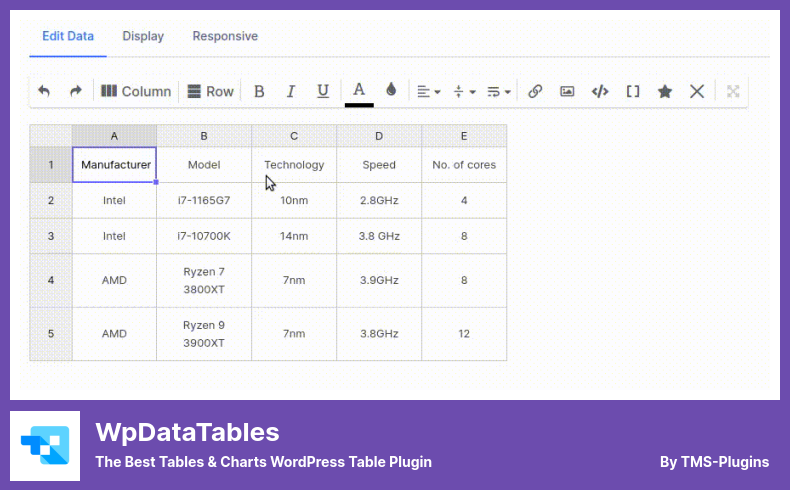
The Best Tables & Charts WordPress Table Plugin
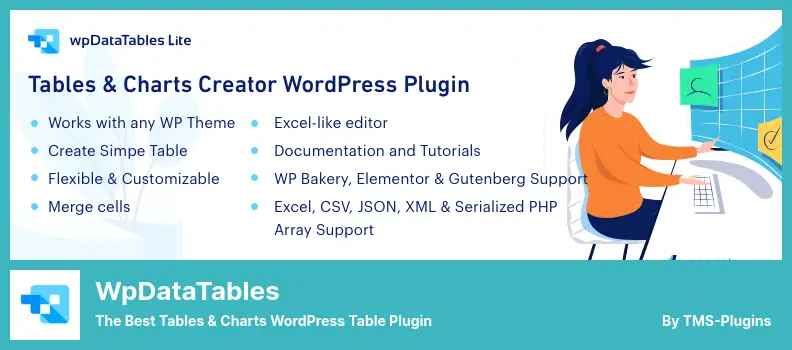
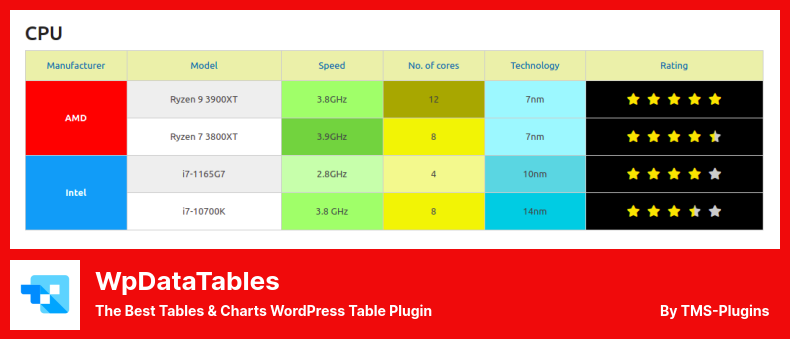
wpDataTables is a WordPress plugin designed to make data visualization and infographics easy for website owners. This plugin allows users to create visually appealing and easy-to-understand charts and graphs from raw data.
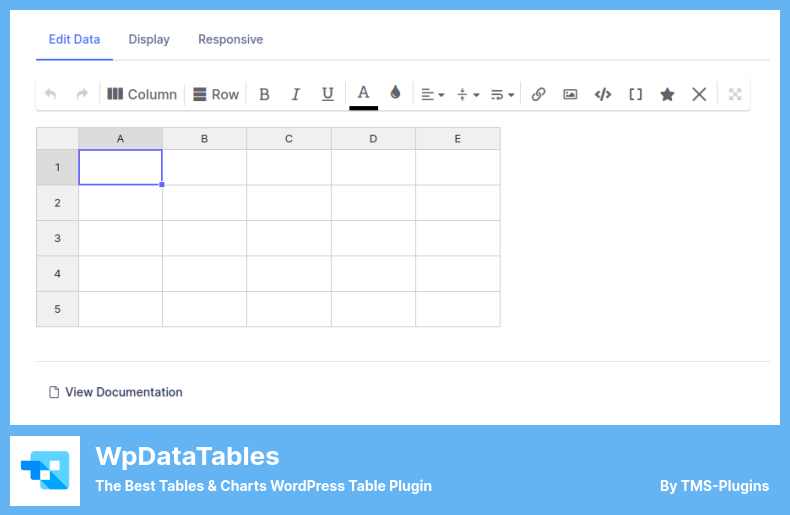
One drawback of the Lite version is its limited functionality, as users are unable to edit tables. However, the plugin has gained popularity among users who want to make their data more visually appealing and easier to understand. You can add data, create plots, and seamlessly display them on both mobile devices and websites.
One of the key features of this plugin is its ability to filter data. You can easily set criteria to display only the results that match specific dates, locations or any other parameters you choose. The visual data can be edited either from the front end (posts/pages) or the administration dashboard.
One notable feature of wpDataTables is its interactive flowchart maker, which allows you to display data from a Google Sheet or Excel spreadsheet directly on your WordPress website. This makes it convenient for users who already have data stored in these formats.
Key Features:
- Large table sizes
- Cell custom formatting
- Add/remove columns and rows
- New border options
- Resize and reorder columns and rows
- Font family customization
Screenshots & Video:
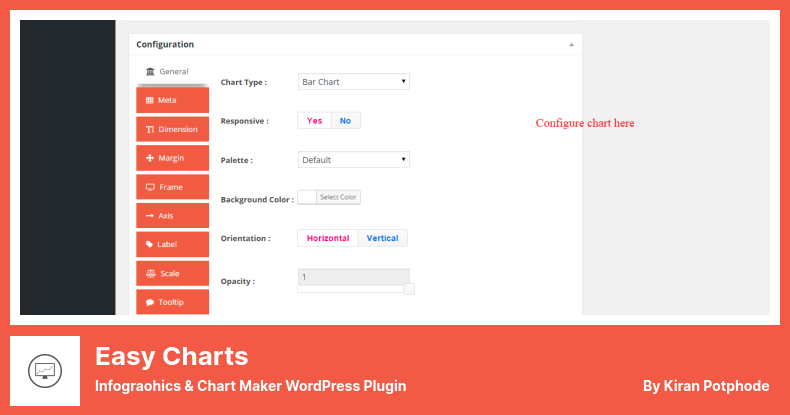
Easy Charts Plugin
Infograohics & Chart Maker WordPress Plugin
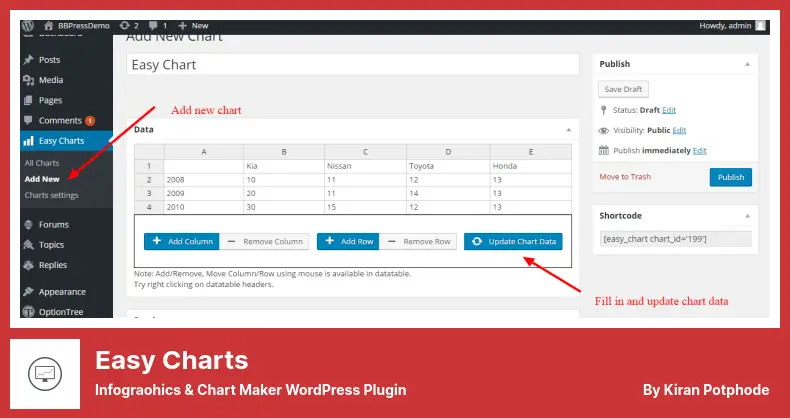
Easy Charts is a WordPress plugin that allows you to effortlessly create stunning charts for your blog posts or pages, even if you have no prior experience. With this plugin, you have the ability to generate various types of charts such as bar graphs, percent-bar graphs, percentage-line graphs, pie graphs, and line graphs.
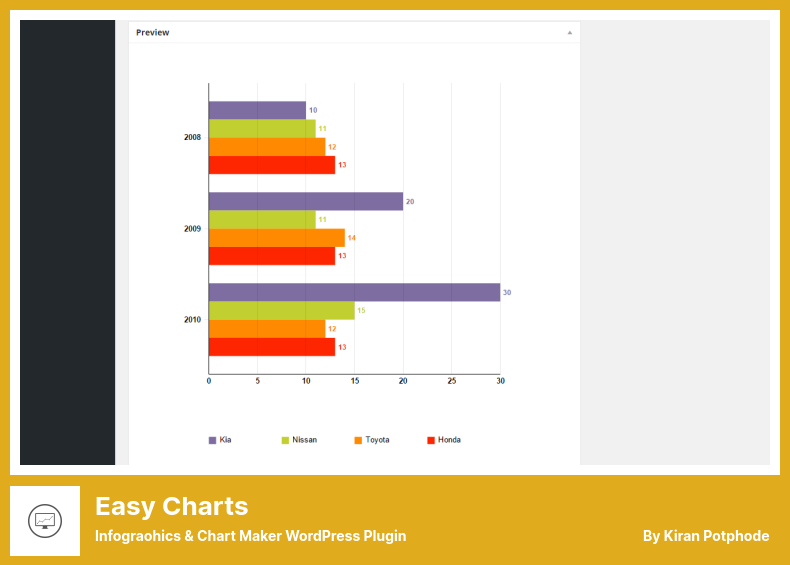
The versatility of the plugin is truly impressive. You can input your data in almost any format, and the plugin offers multiple ways to display your charts. You also have the option to preview your charts before publishing them, ensuring that they meet your expectations.
One standout feature of the plugin is its extensive chart configuration options. The plugin provides a wide array of predefined design and color preferences, allowing you to customize your charts to perfectly match your website’s aesthetic.
Additionally, adding charts to your posts or pages is a breeze with this plugin. You can easily embed them wherever you like, enhancing the visual appeal and engagement of your content.
Another great feature of the plugin is the ability to download your charts as images. This feature is particularly useful if you want to share your charts on social media or include them in presentations or reports.
The plugin is highly configurable and easy to manage, making it a user-friendly solution for all skill levels. Whether you’re a beginner or an experienced WordPress user, you’ll find that the plugin offers a seamless chart creation experience.
One of the standout aspects of the plugin is its flexibility when it comes to data manipulation. You can make changes to your data without affecting the overall chart type, giving you the flexibility to experiment and refine your visualizations.
The plugin also provides an on-screen preview feature, allowing you to see exactly how your chart will appear to your readers. This eliminates the need for guesswork and ensures that your charts look polished and professional.
Key Features:
- Ability to download charts as images for easy sharing and inclusion in various media
- Highly configurable and user-friendly chart management
- Compatibility with various data formats and flexibility in data manipulation
- Predefined design and color preferences for easy chart customization
- Seamless integration with any post or page for effortless chart embedding
- On-screen preview for immediate visualization assessment
Screenshot:
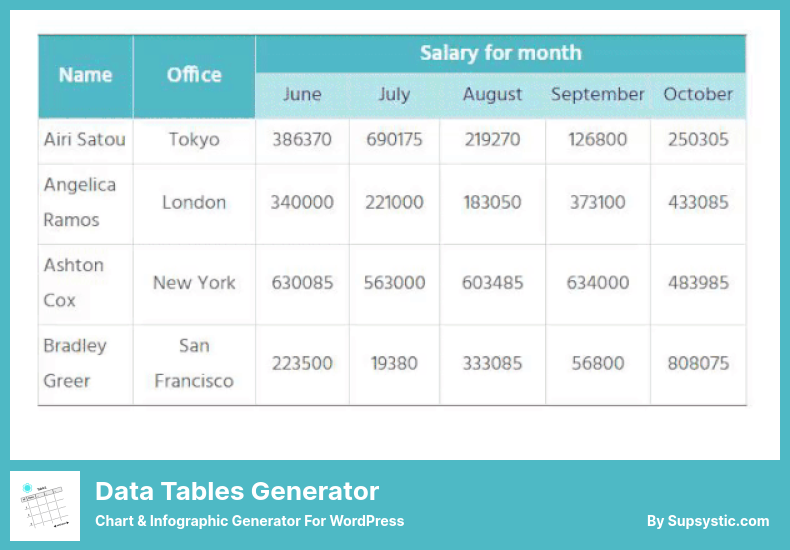
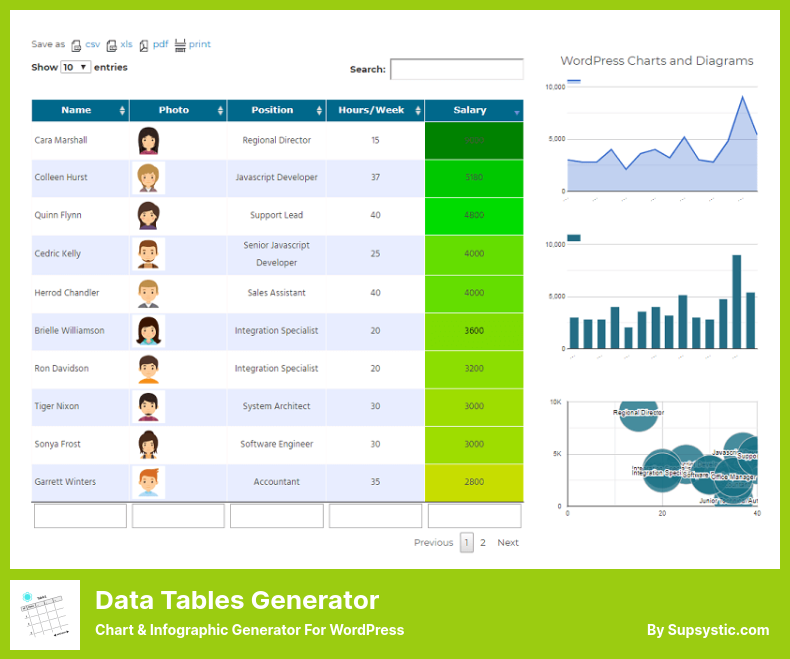
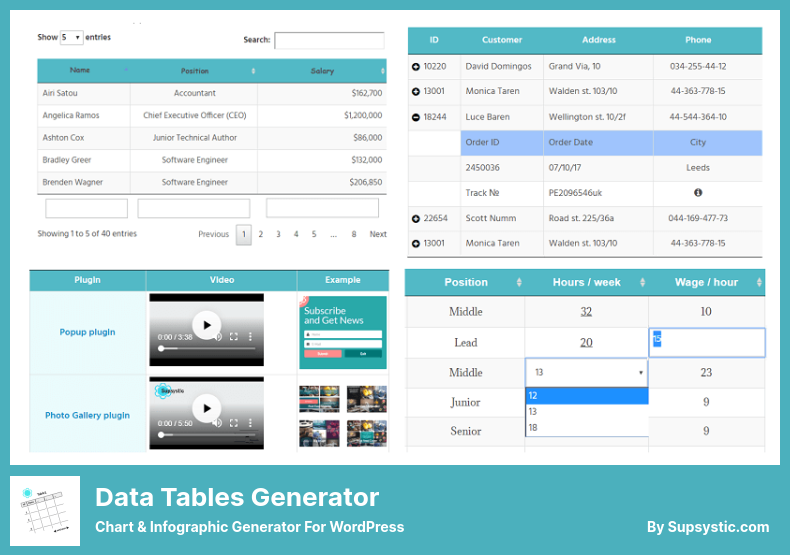
Data Tables Generator Plugin
Chart & Infographic Generator for WordPress
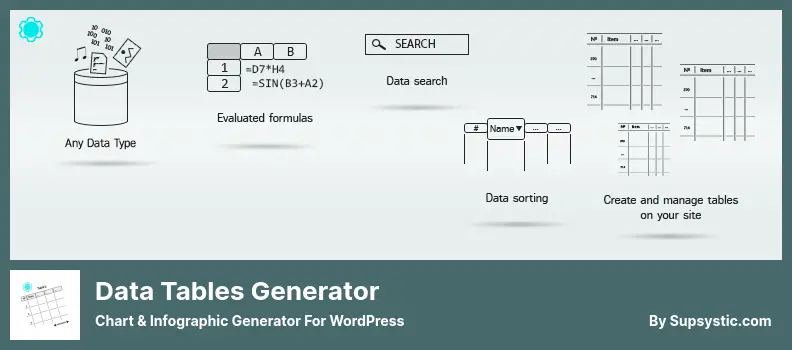
Data Tables Generator is a WordPress plugin that allows you to import data from various file formats and create charts, graphs, and data visualizations. It makes presenting information in an easy-to-understand manner a breeze, even if you’re not a tech expert.
The Pro version offers more advanced features than the basic version. In this case, the Pro version provides access to “Google Charts technology,” which is a tool for creating interactive and customizable charts, graphs, and other visualizations using data.
One of the standout features is its ability to import data from different sources, including CSV and Excel files, PDF files, and even Google Sheets. This means that you can easily integrate data from different platforms and present it in a visually appealing way on your WordPress website.
Another key feature of this plugin is its versatility. It allows you to add data tables to your WooCommerce store, making it easier to display products and their attributes. This can be particularly useful for e-commerce websites looking to provide detailed information about their products.
It also supports multiple languages, making it accessible to a wider audience. It offers support for formulas and HTML, allowing you to customize your tables and include interactive elements. The plugin also supports images, links, and videos, giving you the freedom to present your data in a media-rich format.
When it comes to usability, it doesn’t disappoint. It offers responsive modes and supports large tables, ensuring that your data looks great on any device. It also allows for front-end table editing, making it easy to update and modify your tables without having to go through the backend of your WordPress site.
Advanced features such as filters, search, sorting, and pagination provide additional functionality and improve the user experience. These features allow your visitors to easily navigate through your data and find the information they need quickly.
Key Features:
- Advanced features like filters, search, sorting, and pagination improve usability
- Translated into multiple languages for a wider audience
- Support for formulas and HTML customization
- Images, links, and video support for a media-rich experience
- Responsive modes ensure your data looks great on any device
- Front-end table editing for easy updates and modifications
Screenshots & Video:

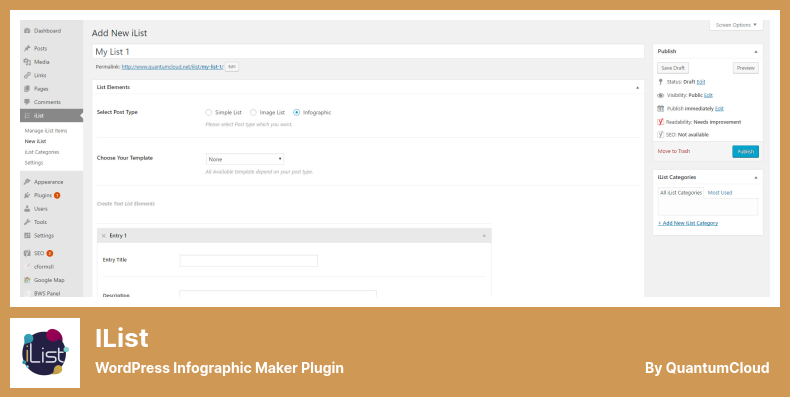
iList Plugin
WordPress Infographic Maker Plugin
iList is a WordPress plugin that allows users to easily create and customize infographics and data visualizations for their websites. It has a search engine optimization-friendly design, which is a great advantage for users looking to optimize their content.
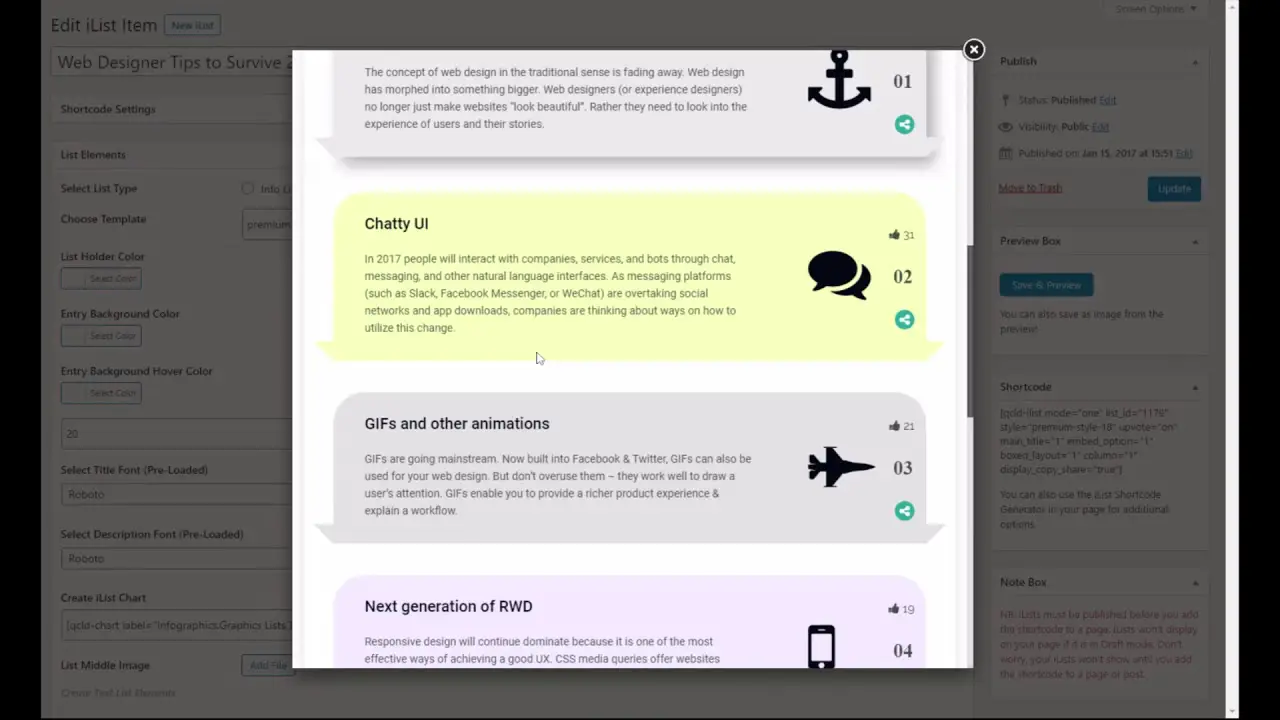
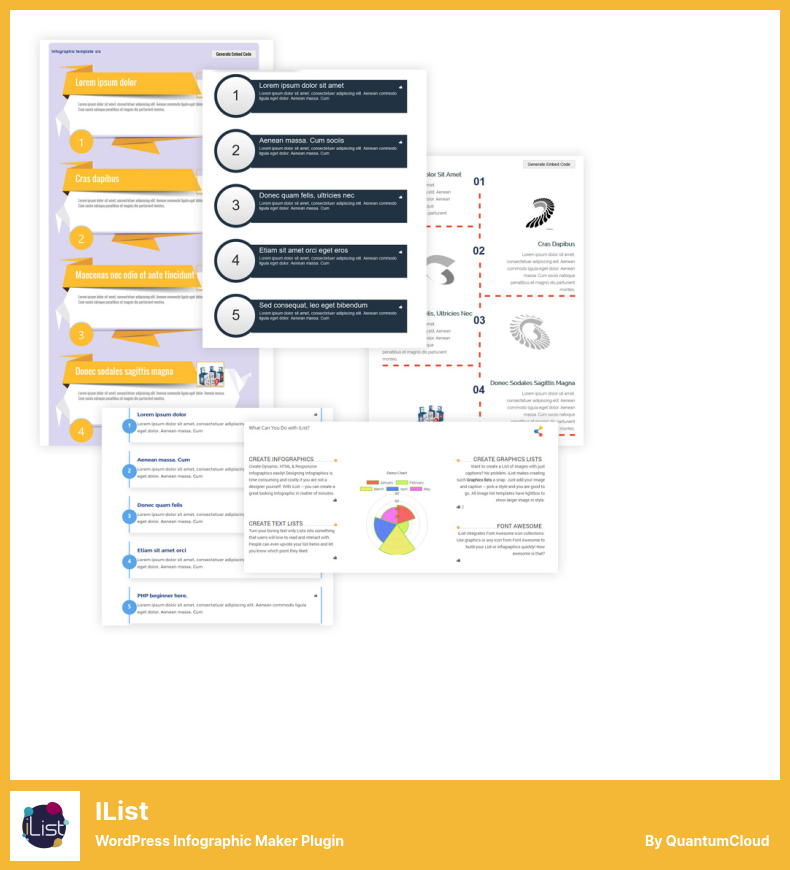
With the plugin, users can position their information graphics exactly where they want them using shortcodes. They can also insert charts and graphs into lists with ease. The plugin offers 14 ready-to-use responsive templates that can be customized with text and images to suit individual needs.
Another great feature is its compatibility with popular page builders like Gutenberg and Elementor. This means users can seamlessly integrate their infographics and data visualizations into their website designs without any hassle.
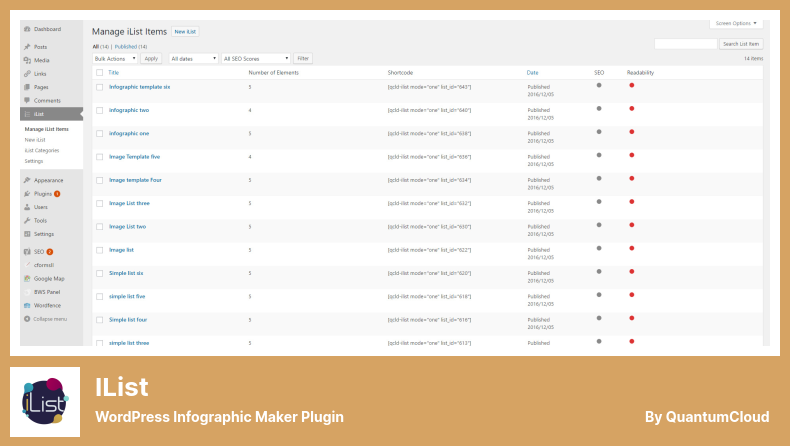
It also allows users to create multi-page listicles with unique URLs, making it easy to organize and navigate through different sections of information. It also offers advertising space for monetization purposes, giving users the opportunity to generate revenue from their infographics.
The plugin comes with 80 built-in templates, all of which can be customized within the theme’s folder. This allows users to have full control over the design and appearance of their infographics. And the best part is that users can preview their infographics directly in the WordPress backend before publishing them live.
The plugin also offers customizable colors and fonts, allowing users to match the look and feel of their infographics to their brand or website aesthetic. This adds a personal touch and helps create a cohesive visual identity.
One of the standout features of iList is the ability to create embeddable infographics that can be easily shared on other websites. This feature makes it effortless for users to promote their infographics and reach a wider audience.
Key Features:
- Create multi-page listicles with unique URLs and advertising space
- Create dynamic image or text lists
- Compatible with Gutenberg and Elementor page builders
- Preview in WordPress backend
- Customizable colors and fonts
- Embeddable infographics that can be shared on other websites
Screenshots & Video:
Infogram Plugin
Charts, Maps and Infographics Generator WordPress Plugin
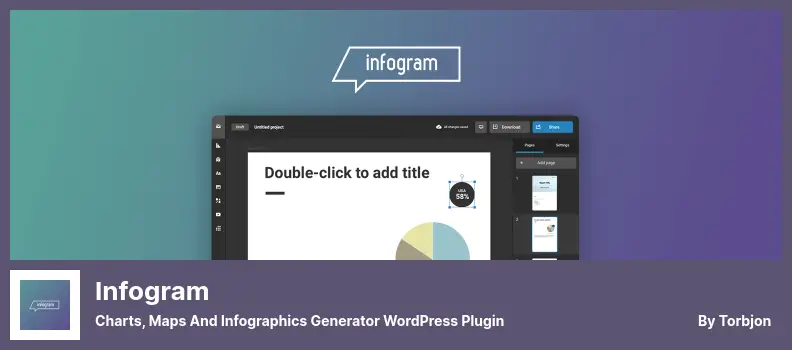
Infogram is a WordPress plugin that allows you to effortlessly embed eye-catching data visualizations from your WordPress library onto your website. This plugin is perfect for journalists, civic leaders, and businesspeople who want to present their data in a visually appealing and interactive way.
You can create stunning data visualizations without any hassle. You can choose from a variety of predefined colors and styles, so you can focus on the data while the plugin takes care of the design. Additionally, it offers a wide range of icons and images, giving you plenty of options to enhance your visualizations.
One of the standout features is its interactive capabilities. You can add interactive pie charts and bar graphs to your WordPress site, allowing your audience to interact with your data. Additionally, you can create custom widgets to display your data in a more engaging manner.
Not only is it user-friendly, but it also offers some handy features to make your data visualization projects even smoother. You can easily import data into your visualizations, making the process quick and seamless.
The plugin also allows for team collaboration, so multiple users can work on the site simultaneously. Plus, you can easily track who is working on each project and restore earlier versions if needed.
Key Features:
- Interactive reports and visualizations
- Customizable templates with your brand’s look and feel
- Easy team collaboration
- Simple data import
- Version control for easy project management
- Wide range of icons and images for customization
Screenshots & Video:


UberChart Plugin
WordPress Chart Generator Plugin
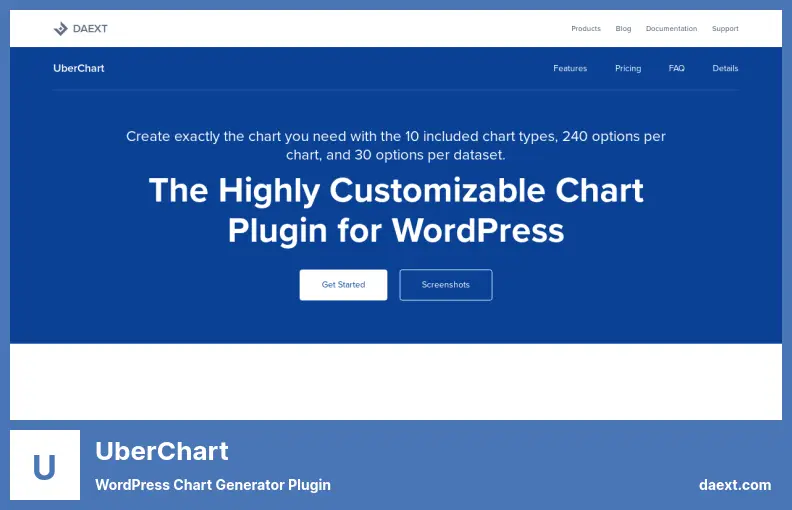
UberChart is a WordPress plugin that allows you to easily create and customize stunning charts for your website. With a range of customization options, including color and font choices, as well as different types of animations, you can quickly create visually appealing charts that will enhance your blog posts.
One of the standout features of the plugin is its versatility. It offers ten different types of charts, including bar charts, so you can choose the perfect style to suit your data.
The plugin also provides over 30 options for customization for each set of data and an impressive 240 options for each chart, giving you complete control over the appearance of your charts.
The plugin also offers the ability to customize the axes and scales of your charts, allowing you to present your data in a way that is most effective and clear.
If you need to make changes to your charts in the future, updating them is a breeze with just a few clicks. The plugin even allows you to duplicate charts as templates for future use, saving you time and effort in creating new charts.
Some other handy features include a spreadsheet editor that makes it easy to input and edit your data, and the ability to import data using a CSV file or directly from Google Spreadsheets or Excel. You can also view a live preview of your chart before finalizing your design, ensuring you are satisfied with the result.
UberChart is multi-language compatible and works seamlessly across different browsers, ensuring that your charts are accessible to all users. It can be activated on single sub-sites or across an entire network, making it flexible for different website setups.
Key Features:
- Spreadsheet editor for easy data input
- Extensive customization options for colors, margins, padding, and radius
- Import data using a CSV file or Google Spreadsheets/Excel
- Multi-language functionality for global reach
- Cross-browser compatibility for maximum accessibility
- Activate on single sub-sites or across a network
Frequently Asked Questions
Most of the WordPress infographic and data visualization plugins featured in the article are designed to be user-friendly and do not require advanced technical knowledge.
However, it’s always helpful to have a basic understanding of WordPress and its functionalities to make the most out of these plugins.
Yes, these infographic and data visualization plugins typically offer customization options to match the design and branding of your website. You can often customize colors, fonts, styles, and layouts to ensure the visualizations seamlessly integrate with your website’s overall look and feel.
Infographic plugins on a WordPress website offer several benefits. They make it easy to create visually appealing and engaging content that can effectively communicate complex information.
These plugins provide a range of templates, customization options, and data visualization tools, allowing users to present data in a visually appealing and easily understandable format.
Additionally, infographics can improve website traffic, increase user engagement, and enhance the overall design and user experience of a WordPress website.
Generally, infographic plugins can be used with any WordPress theme. These plugins are designed to be compatible with most themes and offer flexibility in terms of customization.
However, it’s important to check the plugin’s documentation or reviews to ensure compatibility and any potential conflicts with specific themes or plugins.
Additionally, some premium plugins may offer better compatibility and integration options compared to free plugins.
Conclusion
To briefly recap, in this article, we explored the top seven WordPress infographic and data visualization plugins, both free and premium. We discussed their features, functionality, and compatibility with WordPress websites.
Whether you’re looking to display data in a visually appealing way or want to create stunning infographics, these plugins are sure to meet your needs.
For more in-depth tutorials and guides on WordPress plugins and other related topics, we encourage you to visit the BetterStudio blog. Our team regularly publishes informative and helpful content to assist WordPress website owners like yourself.
If you want to stay up to date with the latest tutorials and tips from BetterStudio, we recommend following us on our social media platforms, such as Facebook and Twitter. By doing so, you’ll be the first to know about our newest articles and helpful resources.
Thank you for taking the time to read this article. If you have any questions or encounter any problems while implementing the techniques discussed in this article, please feel free to leave a comment below. Our team and fellow readers will be more than happy to assist you. Happy WordPressing!
